
[Editor’s note: Welcome to the second of our new series on Price Theory problems with Professor Bryan Cutsinger. We reprint this month’s question below; you can also view the original post from earlier this month here. You can also see the solution to last month’s problem here.]
Question:
According to the Energy Information Administration, crude oil jointly supplies gasoline, heating oil, jet fuel, lubricating oils, asphalt, and many other products. Suppose the widespread adoption of electric vehicles (EVs) reduces gasoline demand but does not affect the demand for the other products jointly supplied by oil. How will the widespread adoption of EVs affect the price of these other products?
Answer:
The idea for this question is inspired by Deirdre McCloskey’s terrific price theory text, The Applied Theory of Price. I like this question because it highlights the interconnectedness of markets and how powerful the supply and demand framework can be.
Let’s review two important ideas before getting to the answer.
The first idea is that we can read a demand curve as a schedule showing the maximum quantity consumers are willing to buy at a particular price, or we can read a demand curve as a schedule indicating the highest price consumers are willing to pay for a particular quantity, reflecting the marginal values of different quantities. For example, if the price of oil is $50 per barrel and the quantity of oil demanded at this price is 100 barrels, the marginal value of the 100th barrel is $50.
The second idea is that when a good jointly supplies multiple products, as oil does, the demand curve for that good reflects the vertical sum of the demand curves for those products. For example, suppose that oil jointly supplies just gasoline and jet fuel in fixed proportions. Let’s say that the marginal value of the gasoline produced by the 100th barrel of oil is $30 and the marginal value of jet fuel produced by that same barrel is $20. In this case, the maximum price people would be willing to pay for the 100th barrel would be $30+$20=$50.
With these two ideas in mind, let’s turn to answering the question. To be clear, my answer assumes that both sides of the oil market–suppliers and demanders–are price takers, and that the oil supply curve slopes upwards. We could consider other alternatives to these baseline assumptions, but for our purposes, these assumptions will do.
A fall in gasoline demand reduces both the oil price and the quantity of oil supplied to the market. As a result, the supply of the other distillates produced by oil must also fall since suppliers are producing fewer barrels of oil. Thus, the prices of these distillates must rise to ensure that the quantities of these distillates demanded equals the now lower quantity supplied.
Figure 1 illustrates this scenario graphically. For simplicity, the figure only includes the demand for two distillates–namely, gasoline and jet fuel. The demand curve D_Oil reflects the total demand for oil, i.e., it consists of the demand for oil as gasoline plus the demand for oil as jet fuel. The demand curve d_JF reflects the demand for oil as jet fuel. The vertical distance between the demand for oil as jet fuel, d_JF, and the total demand for oil, D_Oil, represents the demand for oil as gasoline.
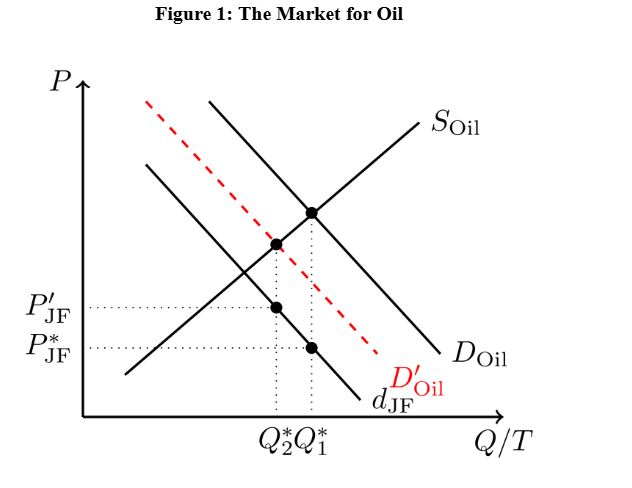
Initially, there are Q*_1 barrels of oil available. At this quantity, the price of oil as jet fuel is P*_JF. Lower gasoline demand reduces the total demand for oil,, illustrated in Figure 1 by the demand curve D’_Oil. At the new price, suppliers are only willing to supply Q*_2 barrels of oil, so the price of jet fuel must rise to P’_JF.
Bryan Cutsinger is an assistant professor of economics in the College of Business at Florida Atlantic University and a Phil Smith Fellow at the Phil Smith Center for Free Enterprise. He is also a fellow with the Sound Money Project at the American Institute for Economic Research, and a member of the editorial board for the journal Public Choice.