
Author
Ahmed Balaha

Author

Share


Close to 9 million BTC – roughly 45–46% of the circulating supply – are currently held at a loss, a threshold that has historically preceded either violent capitulation or the opening of a late-cycle accumulation window.
The last time this metric touched comparable levels was January 2023, in the wreckage of the FTX collapse, when extended consolidation followed rather than a swift reversal.
Whether the current setup resolves the same way or breaks differently is the question every trader holding a BTC position needs to answer right now.
- Metric Reading: ~9 million BTC (45–46% of supply) are underwater, with short-term holders carrying $113.9 billion in unrealized losses.
- Historical Context: Similar readings appeared in January 2023 (post-FTX), mid-2022, and mid-2018 – each preceded further drawdowns of 25% or more before stabilization.
- Current Price: Bitcoin is trading near $65,200–$66,689, approximately 47% below its October 2025 all-time high above $126,000.
- Key Levels: $63,000 is the immediate floor that cannot break; $69,000 is the realized price of 1-month holders and the first meaningful resistance.
- What to Watch: ETF weekly flow totals, whale wallet activity, and whether the Bitcoin Impact Index (currently 57.4) accelerates deeper into its “high impact” zone.
When Half the Supply Goes Underwater, History Has a Clear Message
The metric in focus is percent of supply in loss – every coin whose last on-chain move occurred at a price higher than today’s is counted as underwater.
At current levels near $65,200, that cohort has swelled to nearly 9 million BTC, with peaks near 10 million BTC registered at recent local lows. Long-term holders (coins unmoved for more than six months) have 4.6 million BTC – 30% of their total holdings – in the red, realizing their worst loss profile since 2023.
Prior instances tell a consistent story. In mid-2018, a comparable underwater supply reading preceded a further 50% collapse into the $3,200 December low.
Mid-2022 saw the same signal appear before a grind through the $17,500 capitulation bottom. January 2023 was the exception that proves the rule – the signal appeared, but forced selling had largely exhausted itself, and the market recovered without a second washout.
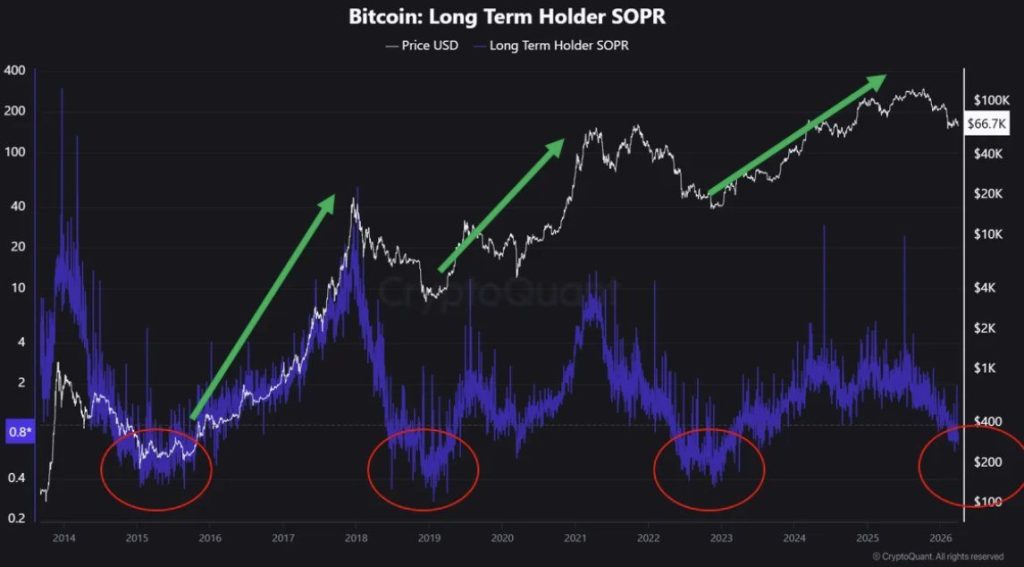
The distinction that mattered in 2023 was the absence of large, active sell-side pressure. That distinction matters now, too.
Analysts at CryptoQuant noted that “when such a large share of supply turns unprofitable, markets enter either capitulation phases or late-stage accumulation zones,” framing the core tension as a question of who dominates the sell side – forced liquidators or patient accumulators. Right now, the data tilts toward the former.
Discover: The best crypto to diversify your portfolio with
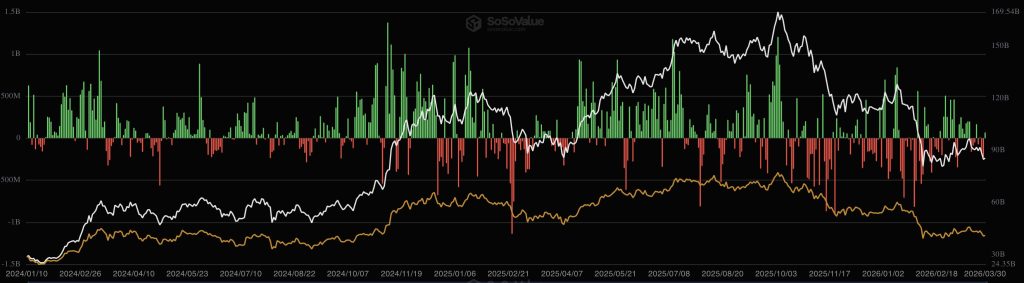
Does the Current Bitcoin On-Chain Setup Match a Price Bottom or a Breakdown?
Spot Bitcoin ETFs have seen $3 billion in net outflows year-to-date, with investors’ average entry price sitting at $83,956 – a 23% paper loss at current prices.
ETF participants alone offloaded over 600 BTC daily last week. The risk-off sentiment driving ETF outflows is compounding an already stressed on-chain picture, with whales shedding more than 43,000 BTC in the past week.
The Bitcoin Impact Index hit 57.4, entering what Checkonchain classifies as a “high impact” zone historically tied to outsized price moves in either direction.
The 1-month holder cohort has a realized price near $69,000; the 1–3 month cohort sits near $90,000 – both levels now function as overhead resistance ceilings, not support.
Glassnode’s Sean Rose flagged “persistent loss realization into rebounds rather than a single climactic selloff” as the defining characteristic of this drawdown, which has unfolded gradually from the $126,000 October peak through $100,000, $90,000, and $80,000 without a single day of panic-volume catharsis.
Right now, it all comes down to flows and how much pressure the market can absorb, because if ETF demand flips back to strong inflows, something like $500 million weekly, and whales keep buying into the weakness, that starts tightening supply again and gives Bitcoin a real shot at reclaiming $69K and pushing higher from there.
But the more realistic setup for now is still compression, with price stuck between $63K and $69K while the market works through all the underwater supply, no panic flush yet, just slow grinding and choppy moves with no clear direction.
The danger zone sits at $63K, because if that level breaks on a daily close, it likely triggers another wave of liquidations, especially from shorter-term holders, and that is where downside can open up fast as more supply gets forced onto the market.
Watch weekly ETF flow data as the leading indicator – it has front-run BTC price direction more reliably than any on-chain metric over the past six months. Any single week with net inflows above $1 billion is the clearest early signal that the bull case is activating. Any acceleration in whale outflows beyond the current 43,000 BTC weekly pace is the bear case trigger.
The six months of sustained bearish conditions that produced this underwater supply reading did not arrive with a single shock, which is exactly what makes resolution harder to time. The market may need the capitulation day it never got.
Discover: The best pre-launch token sales