Close Menu
    What's Hot

    Saab May Arm Gripen Jets With a Cheaper Rocket After Watching Ukraine

    February 7, 2026

    Key Ledger Upgrade Quietly Activated – Why This Could Be the Most Bullish Signal Yet

    February 7, 2026

    Asia’s Biggest Aviation Event Shows the Counter-Drone Craze Is Alive

    February 7, 2026
    Facebook X (Twitter) Instagram
    Hot Paths
    • Home
    • News
    • Politics
    • Money
    • Personal Finance
    • Business
    • Economy
    • Investing
    • Markets
      • Stocks
      • Futures & Commodities
      • Crypto
      • Forex
    • Technology
    Facebook X (Twitter) Instagram
    Hot Paths
    Home»Markets»Crypto»Bitcoin Falls Below $95K, But ETF Demand Just Hit Statistical Extremes – Are Whales Loading Up Again?
    Crypto

    Bitcoin Falls Below $95K, But ETF Demand Just Hit Statistical Extremes – Are Whales Loading Up Again?

    Press RoomBy Press RoomJanuary 20, 2026No Comments4 Mins Read
    Facebook Twitter Pinterest LinkedIn Tumblr Email
    Share
    Facebook Twitter LinkedIn Pinterest Email

    Crypto Journalist

    Anas Hassan

    Crypto Journalist

    Anas HassanVerified

    Part of the Team Since

    Jun 2025

    About Author

    Anas is a crypto native journalist and SEO writer with over five years of writing experience covering blockchain, crypto, DeFi, and emerging tech.

    Share

    Last updated: 

    January 20, 2026

    Bitcoin Falls Below $95K, But ETF Demand Just Hit Statistical Extremes – Are Whales Loading Up Again?

    Bitcoin has slipped below $95,000 this week after retreating from recent highs near $98,000, yet institutional demand signals are flashing their strongest readings in months as U.S. spot ETF inflows surge beyond statistical extremes.

    Despite the price pullback, on-chain data shows tightening sell-side pressure and renewed accumulation, suggesting whales may be loading up during the consolidation.

    Glassnode’s latest market pulse confirms that Bitcoin remains in a consolidation phase rather than in a trend deterioration, with the 14-day RSI cooling from 63.6 to 61.0 while remaining above neutral territory.

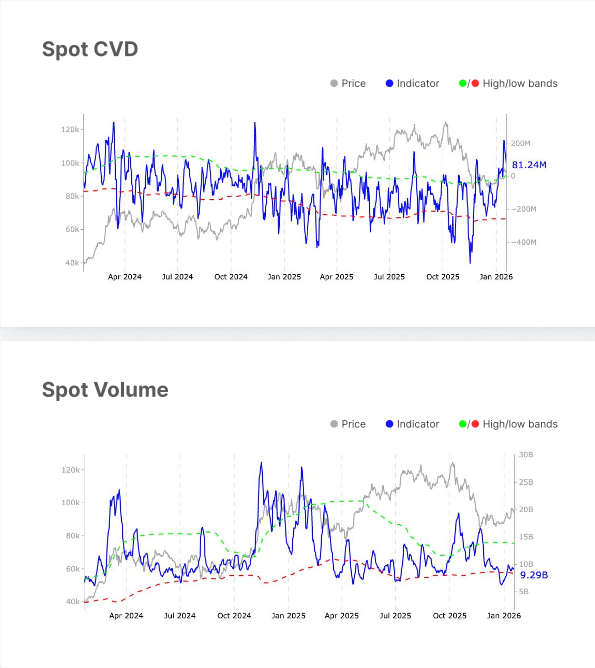
    Spot trading volume climbed modestly from $8.8 billion to $9.3 billion, accompanied by a dramatic shift in net buy-sell imbalance that broke above its upper statistical band, soaring from -$4.6 million to $81.2 million, a 1,877% increase indicating an aggressive reduction in sell-side pressure.

    Bitcoin ETF Demand - Spot CVD and Spot Volume Chart
    Source: Glassnode

    ETF Demand Reaches Statistical Extremes

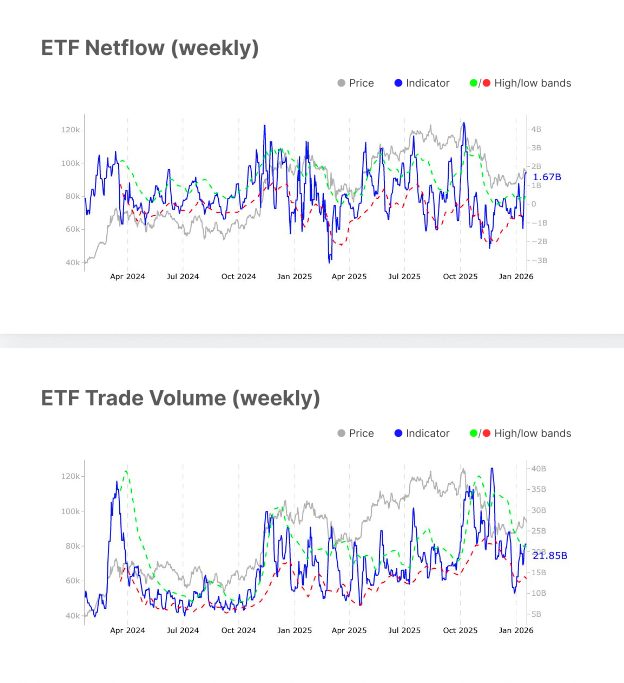
    U.S. spot Bitcoin ETF flows executed a sharp reversal last week, swinging from $1.3 billion in outflows to $1.7 billion in inflows and pushing activity well beyond statistical norms.

    The extreme reading indicates renewed institutional accumulation, with weekly ETF trading volume surging from $16.8 billion to $21.8 billion and both metrics sitting above their historical ranges.

    Bitcoin ETF Demand - ETF Netflow and ETF Trade Volume Charts
    Source: Glassnode

    BlackRock’s IBIT dominated the inflow surge, capturing $1.035 billion during the January 12–16 trading week and accounting for nearly three-quarters of total Bitcoin ETF demand.

    CryptoQuant CEO Ki Young Ju confirmed the institutional accumulation trend, stating, “Institutional demand for Bitcoin remains strong.“

    Institutional demand for Bitcoin remains strong.

    US custody wallets typically hold 100-1,000 BTC each. Excluding exchanges and miners, this gives a rough read on institutional demand. ETF holdings included.

    577K BTC ($53B) added over the past year, and still flowing in. pic.twitter.com/kG1c8dTvlq

    — Ki Young Ju (@ki_young_ju) January 19, 2026

    He noted that U.S. custody wallets (typically holding 100 to 1,000 BTC each) added 577,000 BTC worth $53 billion over the past year, with flows continuing into January despite price consolidation.

    The ETF MVRV ratio edged up to 1.71, sitting just above its upper statistical band and indicating ETF holders remain comfortably in profit.

    Bitcoin ETF Demand - ETF MVRV Chart
    Source: Glassnode

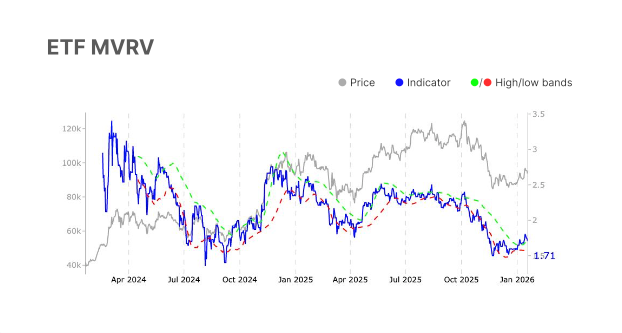
    Glassnode analysts flagged this elevated profitability as introducing a mild near-term profit-taking risk, though overall sentiment remains constructive as institutions continue to build positions.

    Mixed Derivatives Positioning Amid Cooling Leverage

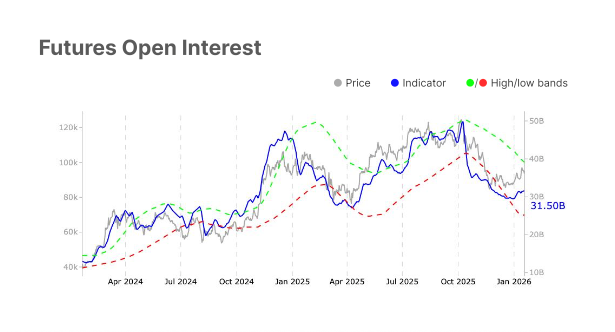
    Futures markets sent mixed signals as open interest rose from $31.0 billion to $31.5 billion, reflecting what Glassnode analysts term as “cautious” rebuilding of speculative engagement.

    Bitcoin ETF Demand - Futures Open Interest Chart
    Source: Glassnode

    Funding rates collapsed by 60.6%, from $1.5 million to $0.6 million daily, indicating sharply reduced long-side urgency and a more balanced positioning after recent exuberance.

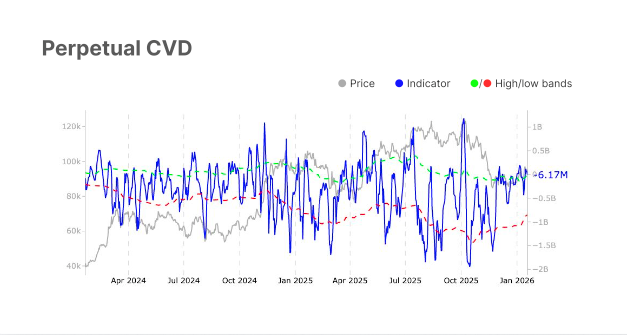
    Perpetual cumulative volume delta improved from -$437.7 million to -$6.2 million, breaking above its upper statistical band.

    Bitcoin ETF Demand - Perpetual CVD Chart
    Source: Glassnode

    Options markets continued to price elevated uncertainty, with open interest rising from $29.96 billion to $32.89 billion while the volatility spread widened from 42.8% to 44.6%, near the upper end of its historical range.

    On-Chain Activity Stabilizes With Cautious Improvement

    Fundamental blockchain metrics showed tentative recovery across multiple indicators.

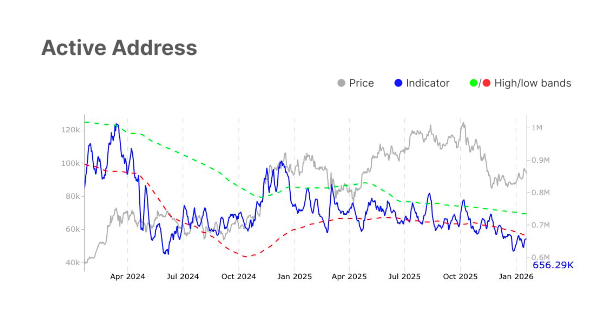
    Active addresses increased 3.8% to 656,294, remaining below the lower statistical band but suggesting improving network engagement without speculative excess.

    Bitcoin ETF Demand - Active Address Chart
    Source: Glassnode

    Entity-adjusted transfer volume rose 3.9% to $8.6 billion, maintaining balanced on-chain activity.

    Bitcoin fee volume climbed 13.2% to $241,100, rising above the lower statistical band.

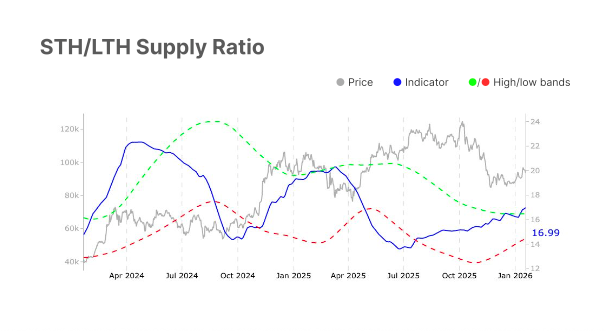
    The short-term-to-long-term holder supply ratio also increased from 16.7% to 17.0%, moving above its upper statistical band amid growing trading activity alongside potentially higher volatility.

    Bitcoin ETF Demand - STH/LTH Supply Ratio Chart
    Source: Glassnode

    Realized cap change also improved from -0.3% to -0.1%, indicating stabilizing capital flows and easing sell-side pressure.

    The percent of supply in profit rose from 70.6% to 75.1%, while net unrealized profit/loss improved from -8.1% to -3.8%, with both metrics indicating reduced market stress and recovering investor sentiment.

    Ethereum ETFs particularly demonstrated strength in December, with Fidelity’s FETH attracting $59.25 million and Grayscale’s Ethereum Mini Trust adding $39.21 million, ranking among the top 10 U.S. ETPs by net inflows.

    January flows accelerated further, with spot Ethereum ETFs capturing $479 million during the Jan. 12–16 week, led by BlackRock’s ETHA at $219 million.


    Share. Facebook Twitter Pinterest LinkedIn Tumblr Email
    Press Room

    Related Posts

    Key Ledger Upgrade Quietly Activated – Why This Could Be the Most Bullish Signal Yet

    February 7, 2026

    Best Crypto to Buy Now February 6 – XRP, Solana, Bitcoin

    February 7, 2026

    $80 SOL Looks Scary – But Smart Money Just Signaled This Might Be the Bottom

    February 6, 2026
    Leave A Reply Cancel Reply

    LATEST NEWS

    Saab May Arm Gripen Jets With a Cheaper Rocket After Watching Ukraine

    February 7, 2026

    Key Ledger Upgrade Quietly Activated – Why This Could Be the Most Bullish Signal Yet

    February 7, 2026

    Asia’s Biggest Aviation Event Shows the Counter-Drone Craze Is Alive

    February 7, 2026

    Best Crypto to Buy Now February 6 – XRP, Solana, Bitcoin

    February 7, 2026
    POPULAR
    Business

    The Business of Formula One

    May 27, 2023
    Business

    Weddings and divorce: the scourge of investment returns

    May 27, 2023
    Business

    How F1 found a secret fuel to accelerate media rights growth

    May 27, 2023
    Advertisement
    Load WordPress Sites in as fast as 37ms!

    Archives

    • February 2026
    • January 2026
    • December 2025
    • November 2025
    • October 2025
    • September 2025
    • August 2025
    • July 2025
    • June 2025
    • May 2025
    • April 2025
    • March 2025
    • February 2025
    • January 2025
    • December 2024
    • November 2024
    • April 2024
    • March 2024
    • February 2024
    • January 2024
    • December 2023
    • November 2023
    • October 2023
    • September 2023
    • May 2023

    Categories

    • Business
    • Crypto
    • Economy
    • Forex
    • Futures & Commodities
    • Investing
    • Market Data
    • Money
    • News
    • Personal Finance
    • Politics
    • Stocks
    • Technology

    Your source for the serious news. This demo is crafted specifically to exhibit the use of the theme as a news site. Visit our main page for more demos.

    We're social. Connect with us:

    Facebook X (Twitter) Instagram Pinterest YouTube

    Subscribe to Updates

    Get the latest creative news from FooBar about art, design and business.

    Facebook X (Twitter) Instagram Pinterest
    • Home
    • Buy Now
    © 2026 ThemeSphere. Designed by ThemeSphere.

    Type above and press Enter to search. Press Esc to cancel.