
Bitcoin has broken below the key $110,000 support zone after weeks of bearish divergence and technical deterioration, raising questions about whether it can stabilize above $105,000 or face deeper corrections toward the psychological $100,000 level.
The decline follows mounting bearish pressure from multiple technical indicators, including a double-top pattern with a neckline around $112,000 and the 50-day EMA at $114,000, which is now acting as strong resistance.
Momentum indicators, including the MACD, have turned negative with bearish crossovers across multiple timeframes, while RSI readings around 59 suggest further downside potential toward the key 50 level.
In fact, the 30-day moving average of the Taker Buy/Sell Ratio has reached its lowest point since May 2018, indicating that the Bitcoin market may face some selling pressure and corrections in the short term.
Bearish Divergences Indicate Deeper Correction Ahead
Multiple analysts have identified strong bearish divergences across weekly, bi-weekly, and monthly timeframes that have been building over several months.
The RSI currently sits at 59, suggesting potential further downside toward the key 50 level based on historical patterns where previous pullbacks tested the 50-week moving average before establishing new uptrends.
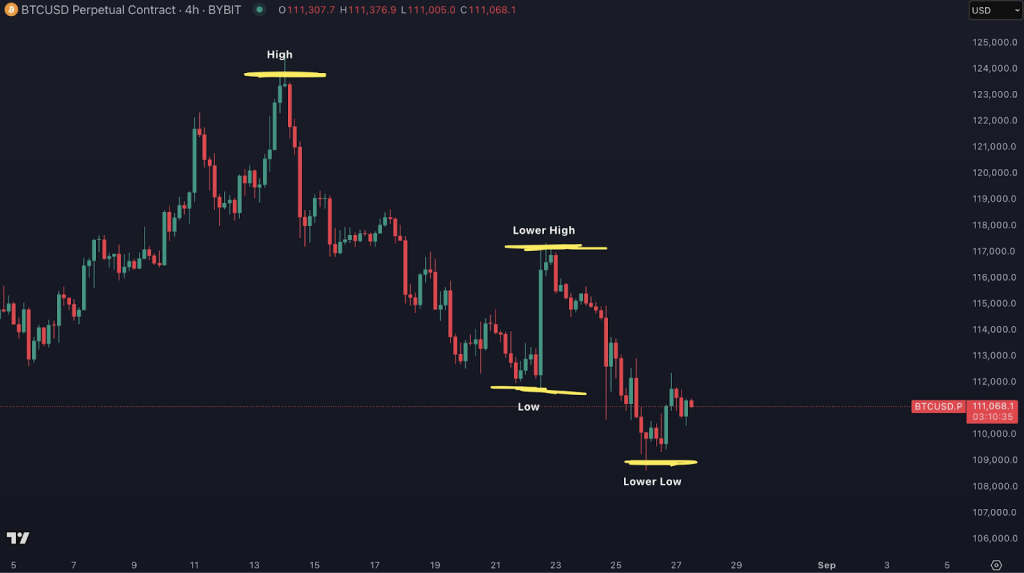
A double-top pattern has formed around $123,250, and the neckline decisively broke below $112,000, confirming the bearish reversal structure.
MACD indicators across multiple timeframes show bearish crossovers, while weekly charts display concerning wick formations that often indicate cycle tops.
The breakdown below $110,000 opens immediate downside targets toward $105,000, with more severe scenarios pointing to tests of the $100,000-$102,000 psychological support zone.
Historical cycle analysis reveals that all major Bitcoin tops are preceded by local peaks, followed by technical deterioration.
The failure of Strategy shares to achieve new highs since November 2024 despite continued BTC accumulation confirms underlying weakness in the “infinite money glitch” narrative.
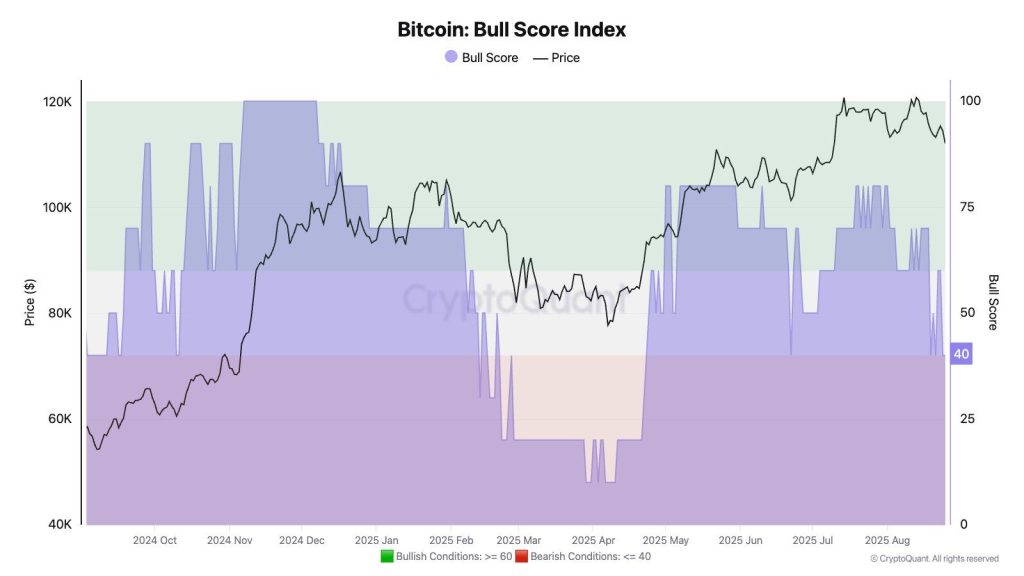
According to the data from this month, CryptoQuant has indicated that the Bull Score Index is now at 40 and has transitioned to the “Getting Bearish” phase.
Seasonal Patterns and Sentiment Extremes Create Mixed Signals
September historically represents Bitcoin’s weakest-performing month, with average losses of 3.77% during bull market years, creating additional headwinds for recovery attempts.
Retail trader sentiment has reached extreme bearish levels following the drop below $113,000, marking the most negative reading since June 22.
Historical analysis suggests that such extreme pessimism often coincides with buying opportunities, as markets frequently move in the opposite direction of crowd expectations.
Institutional accumulation persists despite retail liquidations, with companies such as Strategy and Metaplanet continuing their Bitcoin acquisition strategies.
This creates a divergence between leveraged retail positions being squeezed out and strategic institutional buying during weakness.
Multiple analysts ‘ longer-term projections maintain bullish targets, with Fibonacci extensions pointing toward $155,000 and some scenarios reaching $190,000 during potential “push” phases.
$BTC MACRO EXTENSION TARGETS INCOMING
According to the 3rd Fibonacci level, Bitcoin’s price target stands at $155,000. Despite bearish sentiment, new all-time highs appear likely.#Bitcoin #Crypto pic.twitter.com/RKYLwWwd54
— Bitcoinsensus (@Bitcoinsensus) August 26, 2025


However, given the current technical deterioration, these targets appear increasingly distant and may require months of base-building before they become achievable.
The key juncture centers on daily closes relative to the $111,000 and $108,500 levels, with breaks below confirming deeper correction scenarios toward the $92,000-$98,000 range.
Conversely, a successful defense of current support could establish conditions for counter-trend bounces. However, bearish divergences suggest that any rallies may face strong resistance.
Technical Recovery Scenarios Point to Gradual Base Formation
Despite the bearish breakdown, Bitcoin’s long-term infrastructure remains intact, with institutional adoption continuing through corporate treasury strategies and improvements in regulatory clarity.
The pullback toward the 50-week moving average aligns with historical cycle patterns where major corrections establish launching pads for subsequent advances.
Key recovery levels include reclaiming $112,000 as support with sustained volume, followed by breaking back above the 50-day EMA at $114,000.
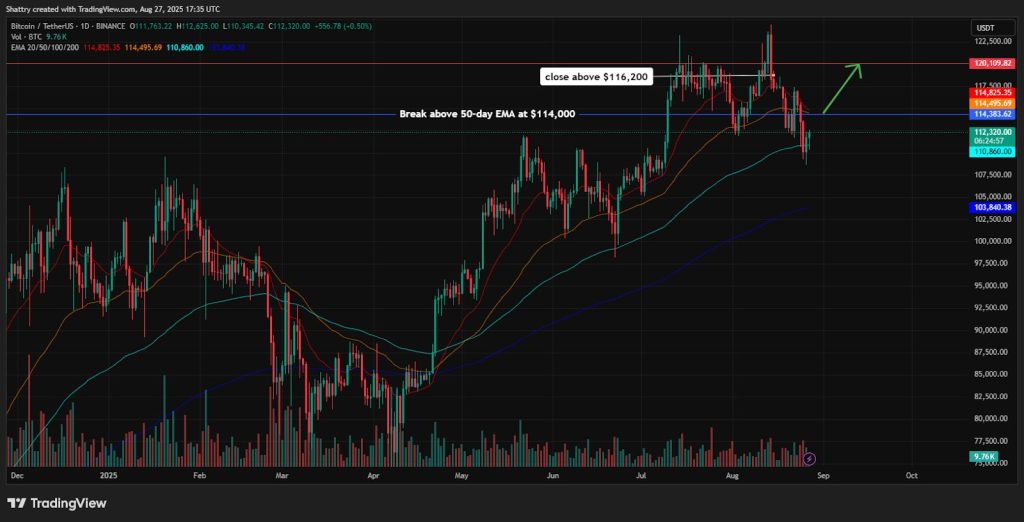
A successful close above $116,200 would negate the immediate bearish structure and open targets toward previous resistance levels around $120,000.
Volume analysis during any bounce attempts will be key, with institutional accumulation patterns likely to emerge at lower price levels as strategic buyers view corrections as an opportunity.
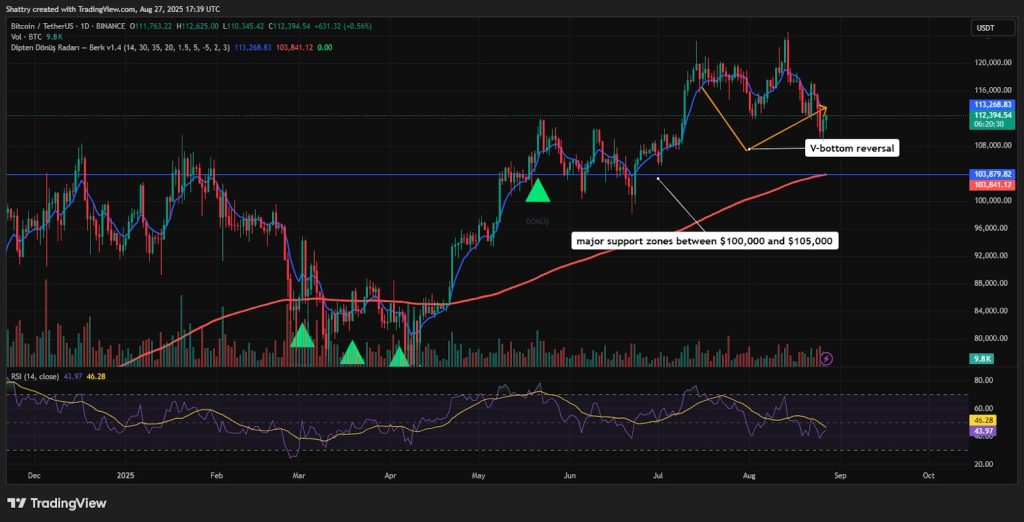
The test of major support zones between $100,000 and $105,000 could establish the foundation for a multi-month consolidation before renewed uptrends.
Momentum indicators require time to reset from oversold conditions, with RSI below 50 needing to establish higher lows and MACD histograms requiring positive divergence formation.
The timeframe for technical repair could extend from several weeks to months, depending on the depth of the current correction.
Recovery scenarios favor gradual accumulation phases rather than sharp V-bottom reversals. Successful defense of major support levels provides the groundwork for the eventual resumption of uptrends toward the next target.
The post Bitcoin Drops Below $110K – What is the Next Support? appeared first on Cryptonews.