
China recently experienced a housing crash that is comparable in size to what the US experienced during 2006-10. Before considering the impact of that housing crash, let’s review what happened in the US.
Between January 2006 and April 2008, housing construction in the US plunged by more than 50%. Despite that crash the economy continued to do fairly well, as other sectors picked up the slack. Unemployment edged up from 4.7% to 5.0%, still a very strong labor market.
During mid-2008, the Fed adopted one of the tightest monetary policies in US history, and NGDP began declining. Housing construction declined even further, to a level roughly 70% below the January 2006 peak. More importantly, other sectors also began declining. Unemployment soared from 5% to 10% of the labor force. It was the worst recession since the 1930s.
A fascinating new paper by Fed economists William L. Barcelona, Danilo Cascaldi-Garcia, Jasper J. Hoek, and Eva Van Leemput shows that China has recently experienced a very similar housing construction slump:
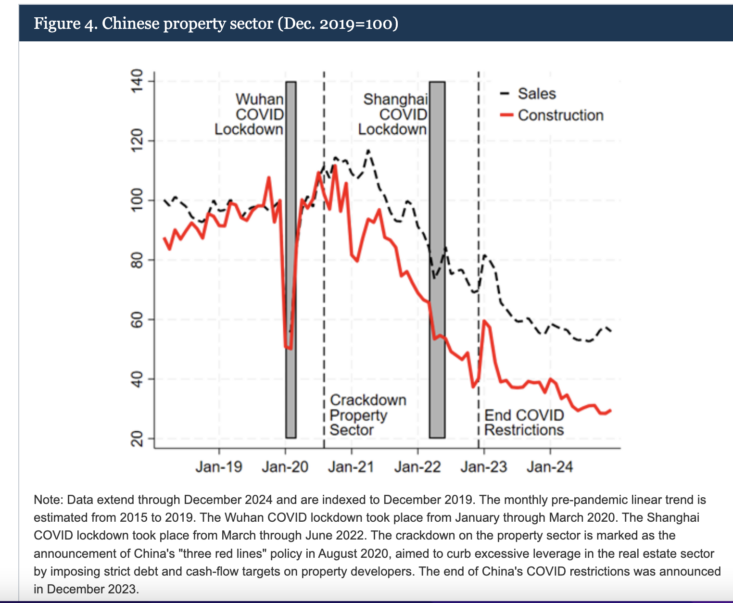
In some respects, it was an even bigger shock than the US housing crash. China’s property sector was roughly 30% of China’s GDP at its cyclical peak (including indirect effects), a far higher ratio than the US experienced during the 2005-06 housing boom. The authors seem to have found it surprising that Chinese GDP growth has held up fairly well, despite a severe housing slump in such a key sector of the Chinese economy:
While 5 percent growth is far slower than the 10 percent average growth China sustained from the 1980s to the early 2010s, it could be considered high considering that China is undergoing a years-long property market correction. Prior to this downturn, estimates suggest that the property market directly or indirectly accounted for up to 30 percent of GDP, and the official data suggest that real estate and construction activity contributed more than 1 percentage point to GDP growth (Rogoff and Yang, 2024). With the property market bubble bursting over the past few years, that boost has turned into a drag that should be weighing materially on GDP growth.
3. China Activity Data
What explains the strong growth, relative to what the property sector malaise would suggest? We can get insights by looking at some of the indicators that go into the model. These indicators tell us that different parts of the Chinese economy fared very differently in the post-pandemic period.
Panel (a) of Figure 3 shows that while industrial production was severely disrupted during the initial lockdowns in Wuhan, it rebounded quickly and, if anything, has exceeded its pre-pandemic trend in recent years.
This is essentially what happened during the first two years of the US housing slump. The Fed kept NGDP growing, and declines in residential construction were mostly offset by increases in manufacturing, exports, services, commercial construction, etc.
I have argued that the People’s Bank of China has been too contractionary in its monetary policy during recent years. Nonetheless, the PBoC has been more expansionary than the Fed was during the 2008-09 period. As a result, Chinese NGDP has kept growing and the overall Chinese economy continues to move forward.
Although the authors work at the Fed, they did not mention the obvious contrast between how China’s central bank handled the housing slump and the way that the Fed mishandled our housing slump. Vaidas Urba directed me to a recent tweet by Zach Mazlish, discussing a new paper:

The paper is by Tomás E. Caravello Alisdair McKay and Christian K. Wolf, and contains the following comments:
The headline finding is that, absent any effective binding lower bound on nominal interest rates, a policy that follows the rule of minimizing (9) would have involved a very aggressive rate cut, down to around -5 per cent. Such an (infeasible) interest rate cut would have materially reduced the output gap, at the cost of moderately elevated inflation.
The results are summarized in Figure 9, which shows realized (black) as well as counterfactual (blue) paths of output, inflation, and interest rates; as before, the blue areas correspond to the posterior across all four of our models, with results for all individual models very similar. Our findings are informative about the broader policy response during the Great Recession. Given constraints on nominal interest rates, policymakers attempted to substitute through other stimulative measures, most notably unconventional monetary policy as well as fiscal stimulus. If we interpret (9) as the objective for monetary policy, our counterfactual suggests that the unconventional monetary policy response was insufficient—in nominal interest rate space, additional stimulus of around 500 basis points would have been necessary.
In a follow-up tweet, Mazlish anticipates one of my two reactions (although I regard late 2007 as slightly too early—I’d guess around June 2008 was appropriate for the ZLB):

A second point I would make is that a better policy regime would have reduced the severity of the negative demand shock of late 2008, and thus reduced the amount of monetary stimulus that would have been necessary. For instance, a credible policy of NGDP level targeting would have created stabilizing expectations of faster future NGDP growth after a brief slump in mid-2008, and this would have prevented the natural interest rate from falling as sharply. And this isn’t just my view, the benefits of level targeting were demonstrated in academic research by people like Ben Bernanke and Michael Woodford, which built on the theoretical framework in Paul Krugman’s seminal 1998 paper.