

Author
Ahmed Balaha


Author

Share
![]()


Brent crude punched through $116 a barrel on March 30, 2026 – a 60% monthly surge driven by escalating US-Iran tensions after Tehran accused Washington of preparing an invasion, compounding Houthi strike disruptions, and Bitcoin is now sitting in the crosshairs of the resulting institutional risk-off rotation.
The oil price spike is not hitting crypto directly; it’s hitting it through three compounding channels: inflation re-acceleration, delayed Fed rate cuts, and a geopolitical risk premium that is draining leveraged long exposure across every risk asset class.
Bitcoin dropped to weekly lows between $63,000 and $65,700, over $500 million in derivatives liquidations hit the tape, and 84% of that came from long positions.

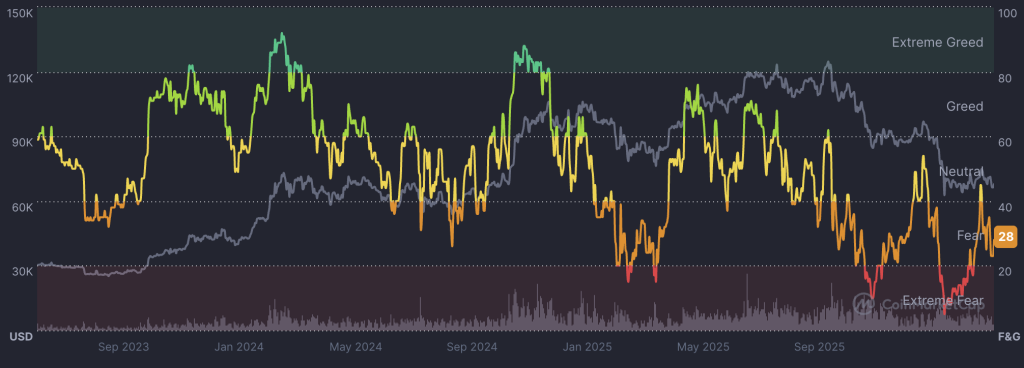
The Fear & Greed Index collapsed to 28 – Extreme Fear – while a record $14 billion options expiry amplified the volatility.
Discover: The best crypto to diversify your portfolio with
Bitcoin Faces Structural Deleveraging as Oil-Driven Inflation Rewrites the Fed Playbook
$63,000 is the line Bitcoin cannot afford to lose.
That level has capped the downside through the prior 2 macro shock episodes. The 200-day moving average sits just below at $62,400.
A close beneath it would be the first since the October 2025 rally began and would likely trigger a second wave of systematic deleveraging from quant funds running momentum strategies. Resistance above is layered at $67,500 and $71,000, both former support zones that flipped during the February selloff.
The oil correlation matters more than usual right now. Binance Research puts the Bitcoin-WTI correlation near zero across most market regimes.
The 30-day rolling correlation currently sits at just 0.15. But that changes during extreme disruption events. The Strait of Hormuz is flowing at roughly 4 million barrels per day against a normal 20 million. That is not a tail risk. That is an active structural supply shock, exactly the kind that produces temporary correlation spikes.
If US-Iran tensions de-escalate and Hormuz flows normalize, Brent retreats below $100 and the Fed signals patience at its April 1 to 2 meeting. Bitcoin reclaims $67,500, BlackRock’s IBIT builds on its $225.2 million inflow during the dip, and institutional rotation flips back into accumulation mode.
If tensions persist without full escalation, Brent holds $110 to $116 and the Fed stays hawkish through Q2. Bitcoin grinds between $63,000 and $68,000 with elevated volatility, ETF flows stay choppy, and mining costs for operators like Marathon Digital rise 15 to 25%.
A full Hormuz blockade is the scenario nobody wants to price. Oil above $130, 10-year Treasury yields breaking above 5%, and the Fed forced to choose between fighting inflation and supporting growth.
That combination could send Bitcoin to $55,000 to $57,000 in a full risk-off liquidation wave, mirroring February 2022 when WTI hit $115 and BTC fell from $45,000 to $39,000 in days.
The inflation channel is what most traders are underweighting. Sustained oil above $100 does not just pressure sentiment. It mechanically delays rate cuts.
Bitcoin’s slide below $67,000 alongside rising Treasury yields already showed how directly that linkage bites. BTC’s 0.9 correlation to the IGV tech index means it trades like a rate-sensitive growth asset in the short run, not an inflation hedge.
Watch the Fed’s April 1 to 2 meeting. Any language signaling a longer hold is the catalyst for the next leg down. Congressional votes on Iran sanctions expected mid-April carry equal weight. Further Hormuz disruption sends another shock through energy markets and straight into institutional risk appetite.
Discover: The best pre-launch token sales