


Nattakorn Maneerat

This article was published on Dividend Kings on Wed, May 24th.
—————————————————————————————
Smart people can make disastrously bad investing decisions.
Isaac Newton invented classical physics and calculus and then lost $25 million in the South Sea Bubble.
That was after first tripling his money and getting sucked back in the right before the stock fell 80%.
Stephen Greenspan literally wrote the book on not getting conned by a con artist and then lost his retirement to Bernie Madoff, the largest con artist in history.
I myself have made and lost several small fortunes in a quarter century of “investing.” Really, it was mostly speculating, chasing the latest “get rich quick” scheme.
When I had to retire from Army Medicine for medical reasons medically, I thought my life was over. I went from training as an Army Surgeon saving soldiers’ lives to a man without a cause until I discovered a new way to serve my country and the world.
I combined my lifelong passion for investing, economics, and several PhDs from the school of hard knocks and started a second career teaching people how to build life-changing fortunes the right way. Including avoiding disastrous mistakes like I made so many times.
- The Tech bubble? I once paid 400 times earnings for a tech stock that soared to a PE of 1700…and then fell 95%
- I once made $75,000 in a day speculating on Apple options and then lost $150,000 the very next day.
- Crypto? I lost $100K in Bitcoin when Celsius went bankrupt
But through getting right with the dividend gods, I was able to rise like a Phoenix from the ashes and soar to new heights. I went from $50K in debt after my divorce in 2016 to becoming a millionaire today.
And guess what? It wasn’t crypto, SPACs, meme stocks, or spec tech like ARKK that got me here.
If there is one thing I love more than teaching regular investors like you how not to lose a fortune, it’s helping friends and family save their financial dreams after losing a fortune.
I helped my best friend, Sean, a computer engineer, recover from an 80% catastrophic loss in his 401K when he YOLOed into “the Robinhood of China.”
My father has four degrees and works in finance. You’d think he would know the road to a rich retirement.
- My Father’s 401(k) Trusts These 5 Blue-Chip Bargains, And So Can You.
But through terrible risk management, including a 65% position in Alibaba, he lost 40% of his 401K during the recent tech crash.
I helped him harness hyper-growth Ultra SWANs’ power to rescue his retirement dreams.
My uncle is the smartest person I know, with a Ph.D. from Princeton, and he lost $1 million in the crypto collapse of 2022.
- How I Built A $1 Million High-Yield Retirement Portfolio With 6 Dividend Blue-Chips.
I helped him rescue his dreams of changing the world through philanthropy with a portfolio inspired by the ZEUS Income Growth portfolio, where my family now keeps our life savings.
Rose, a family friend who made a fortune from selling her Florida home but was terrified to invest in a bear market.
- How I Built A $3 Million High-Yield Portfolio With 11 Blue-Chips.
I helped her build a high-yield ultra-low volatility blue-chip portfolio that let her sleep well at night and stay fully invested through all the insane economic and market turmoil of the last year.
Justin, a family friend who sold a real estate business for $12 million but then lost $1.2 million when his first stock market experience was completely wrong for his risk profile.
- How I Built A $5 Million 6% Yielding Portfolio With 9 Blue-Chips.
Using the Dividend Kings tools and ZEUS strategy for building recession-optimized portfolios, I was able to help Justin create the 6.1% yielding ultra-low volatility portfolio of his dreams.
Today, I want to tell you about a family friend named Greg (not his real name, to protect his privacy).
His story is one I think a lot of people will be able to relate to. His goals, fears, and, most importantly, the smart way that anyone can start a brand new dividend growth portfolio in today’s hyper-uncertain economic times.
Meet Greg: The Greatest Person I’ve Ever Met (And Who Deserves To Be President)
In the heart of the bustling immigrant neighborhood where Greg was raised, dreams were more precious than gold. He was the firstborn son of tenacious parents who had left Guatemala’s rich yet struggling landscapes, driven by the hope of providing their children a better future.
In this vibrant mosaic of cultures and stories, Greg learned the most valuable of lessons: the power of resilience, the strength of tenacity, and the importance of compassion.
His parents, a seamstress and a construction worker, instilled in him an unwavering work ethic and a fiery entrepreneurial spirit that would inspire his life.
From running a small lemonade stand as a boy to creating a mini-electronic repair empire, Greg embodies determination and grit. His business, born from nights of relentless effort and sheer determination, skyrocketed to unimaginable success.
The ultimate validation of his efforts came when he recently sold his company for $22 million, a sum that was once beyond the realm of his or most people’s wildest dreams.
Yet, the conclusion of his entrepreneurial journey is just the beginning of Greg’s story-one with a far greater purpose than personal prosperity.
Guided by memories of his parents’ tales of children back in Guatemala suffering from vitamin A deficiency, Greg dreams of establishing a permanent charitable trust. His mission is as clear as it is noble: eradicating this silent scourge that claims 200,000 lives per year.
But Greg isn’t a preening prima donna, an egotist out to build monuments to his own greatness. He’s not looking to recreate the wheel and start a brand new charity, but instead partner with trailblazers who have already proven they can save millions of lives for as little as $3,500 each.
- Helen Keller International (more of them later).
His trust, born from his compassionate heart, hopefully will save thousands of young lives and eventually millions. Greg’s spirit lives through every child saved, manifesting that success isn’t measured by personal wealth but by the difference one makes in the world.
Greg’s story is not just a tale of an immigrant’s son who achieved unimaginable success.
It’s an epic journey of resilience, a testament to the power of dreams, and a reminder of the incredible difference one person can make. His story is one of hope, inspiring us all to dream bigger, work harder, and, most importantly, never forget the power of giving back.
It’s the kind of story that stirs the soul and leaves an indelible mark on the human heart, truly worthy of an Oscar-winning portrayal.
When a movie is inevitably made about Greg’s life (if there is any justice in the world), I nominate Oscar Issac to play him.
Born to Guatemalan and Cuban parents, Isaac brings the required acting prowess and a personal connection to Greg’s background. His past performances demonstrate a strong capacity to bring Greg’s inspirational story to life on the big screen and potentially inspire millions to follow Greg’s example of “work and invest to give.”
Who Greg Kind of Resembled At The Age Of 34
Dreamstime

What Greg Kind Of Looks Like Today: The Face Of The American Dream And My Personal Hero
Dall-E
A Great Guy Being Driven Crazy By This Year’s Crazy Market
Like Justin, my colleague Brad Thomas, and 70% of the Forbes 400, Greg achieved a fortune through hard work, discipline, patience, and a bit of luck. He’s a classic example of the American dream.
Greg is 53 and lives in Nevada (actually a different state, but he requested I change it to protect his privacy), and in his 20s, he started a computer repair business that later expanded into electronics of all kinds. For three decades, he proudly built his small business into a small chain of stores that he recently sold for $22 million.
After working 12 to 14-hour days, six or seven days per week, for 30 years, Greg was ready to take Buffett’s advice.
If you don’t find a way to make money while you sleep, you will work until you die.” – Warren Buffett
Greg is like Buffett in another way, or he thought he was; he doesn’t fear bear markets. Like the Oracle of Omaha, he was ready to “be greedy when others are fearful.”
Gregg reads my articles on Seeking Alpha and initially was going to build a ZEUS-style dividend growth portfolio, perfectly balanced for his needs and goals.
- He wants to become a philanthropist focusing on saving young children’s lives in Asia and Africa.
But Greg fell into a trap that many of us do. He heard a story about the economy and what the stock market was LIKELY to do, and he let it drive him to a costly mistake.
When the debt ceiling crisis began, Greg was ready to invest $11 million (what he had after paying taxes and donating to charity) into a ZEUS portfolio, but then he read in one of my articles that S&P and Goldman thought the 2023 debt ceiling crisis would be like 2011’s, coming down to the wire.
Ycharts
He saw this chart and thought, “If I go all into ZROZ, I might be able to make $5 or even $6 million in a few weeks. Imagine how much more I will be able to give to charity if I start out with a ZEUS portfolio that’s $6 million larger!”
I wish he had talked to me before he put his plan into action because I would have shown him this table and tried to change his mind.
Charlie Billo
Even perfectly timing the economy doesn’t beat buy-and-hold blue-chip investing, except during the Great Depression.
So what mistake did Gregg make? He bought $11 million worth of ZROZ, the Pimco 25-year US treasury bond ETF.
Tradingview
At first, everything went as planned; ZROZ soared as it looked like inflation would come quickly, and the Fed would create “immaculate disinflation” and a soft landing.
Then the blowout February jobs report changed the narrative overnight. Suddenly everyone was talking about “no landing” and inflation getting stuck near 5%.
Fed Chairman Powell testified before Congress about how rates would have to go higher than expected and maybe even 50 basis points at a time.
On March 8th, the bond market was pricing in a 5.75% peak terminal Fed funds rate, with no cuts this year. On Bloomberg, which Greg watches, they were talking about the Fed maybe having to go to 6% or even 7%.
Greg Panic sold his long bonds at a $1 million loss. That’s just 9%, but these are “risk-free” US treasury bonds, and you can imagine how it felt to lose a fortune in risk-free assets.
- 4 US bank failures so far were caused by poor risk management and owning US bonds that declined in value.
The day after Greg sold his bonds, fearing rates might rise another 1% or even 2% (a 27% to 44% potential loss in ZROZ), Silicon Valley Bank of SVB Financial Group (OTC:SIVBQ) collapsed, and bonds took off in the strongest five-day rally in 42 years.
Can you imagine how it felt to lose $1 million in “risk-free” bonds? Listening to Jerome Powell talk about much higher rates and 50 basis point hikes on Wednesday, and by Thursday, the headlines are screaming about a banking crisis?
Well, it didn’t feel good, and like most people who had just been caught completely offside by massive market moves twice in as many months!
Greg was shell-shocked, so he just sat in cash. Like a lot of young people today, or simply those with a very long time horizon, Greg LOVES growth stocks. He had been planning a ZEUS growth portfolio, but his favorite growth stocks were steadily climbing, and he was terrified of buying right before another major market crash.
Bond yields started climbing again, and growth stocks kept climbing too.
Suddenly the “hard landing” we all thought was coming after the collapse of SVB, Signature Bank (OTC:SBNY), and Credit Suisse Group AG (CS) gave way to a “soft landing” narrative.
Until First Republic failed, and then suddenly bond yields were crashing again, regional banks fell as much as 60% in a day, and everyone is talking about a hard landing again.
But within a week, the crisis seemed to have passed, and the market resumed its rally, and so did bond yields.
What about the debt ceiling crisis that kicked off Greg’s terrible experience with economic market timing?
Did that threat go away?
Statista
Heck no! Moody’s came out warning about a 4% GDP recession that could happen if we defaulted for two months. That’s as bad as the Great Recession.
Then the Joint Economic Committee warned of a potential 6% GDP recession that could be 50% worse than the Great Recession, cost 8 million jobs, and cause stocks to crash 45%.
And now Bloomberg Economics is warning that a 3-month default could cause an 8% GDP recession, twice as bad as the Great Financial Crisis.
Daily Shot
UBS just came out warning that stocks could fall 20% in a single week if we go past the X-date and fall as much as 44% by the end of June.
In another curveball for the market, House speaker Kevin McCarthy left the Capitol late Tuesday saying the two sides had yet to reach a deal over the US debt ceiling, and one of his chief negotiators added there are no more meetings planned. The impasse means it’s likely the House and Senate will both have to vote on any deal next week, mere hours before Treasury Secretary Janet Yellen has said the US could run out of cash. The standoff is weighing on global stocks as investors seek haven assets.” – Bloomberg (emphasis added).
Just like S&P and Goldman predicted at the start of the year, we’re going right down to the wire, risking defaulting on $144 billion in payments to the likes of Medicare and Social Security payments next Thursday and Friday.
CNBC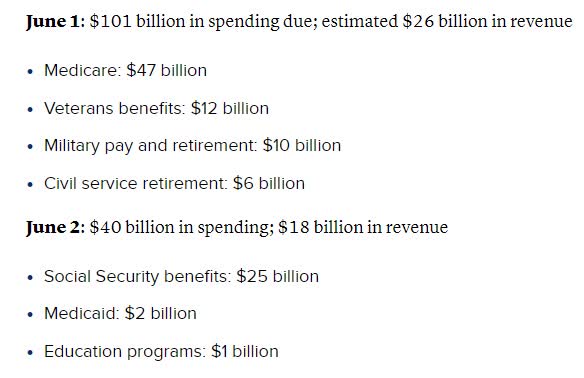

Ok, so now the bond market is finally rallying, and the stock market is crashing, right? Just like 2011?
Nope, stocks are mostly flat, and so are bonds.
What about the most anticipated recession in history? The one that was supposed to start in January and be over by the end of June?
Is that canceled? Does that explain why the financial markets are ignoring the highest default risk in U.S. history (10%, according to Moody’s)?
Bank of America’s (BAC) CEO Brian Moynihan now expects an approximately 1.5% GDP recession to start in July and last nine months. That’s a recession 3X more severe than what the average economist expects.
Ok, so one bank CEO expects a hard landing. But do you know who else does? Ed Hyam the most accurate economist of the last 42 years.
- Approximately 1.5% GDP recession lasting nine months and 5.2% peak unemployment
- 3 million job losses.
And yet the stock market sits there, refusing to budge out of a freakishly stable trading range.
Why?
Daily Shot
Because of an AI tech stock rally that has the S&P 9 doing great while the S&P 491 is down for the year.
Daily Shot
The S&P is actually down on the year, with the market-cap weighted index held aloft by nine companies.
Daily Shot
It’s always and forever a market of stocks, not a stock market. But in 2023, that’s especially true.
“What The Frack Do I Do Now?”
This is a question many investors are asking themselves these days.
Nobody can predict interest rates, the future direction of the economy, or the stock market. Dismiss all such forecasts and concentrate on what’s actually happening to the companies in which you’ve invested.”- Peter Lynch.
It’s easy to quote the greatest investors in history or show through dozens of studies, charts, and tables that buying a diversified portfolio right for your goals is the best option.
But investing $10 million ahead of what might be the top of an AI tech bubble is very different.
Ycharts
A bubble that could end as early as Wed night, when Nvidia Corporation (NVDA), the king of the AI bubble stocks, reports earnings priced as if God were running the company.
- If You’ve Bought Nvidia Stock This Year, Sell Before Earnings (Downgrade).
What happens if the king of AI hype disappoints on earnings for the first time in 3.5 years?
- When I lost $150K in Apple in a single day, it hadn’t missed earnings in eight years.
The AI hype bubble could pop overnight, collapsing extra fast by fears of a debt ceiling default.
- Don’t forget that on June 1 and June 2; the US is obligated to pay $144 billion that we don’t have and won’t have.
If the nine stocks holding up the market, which is primarily being driven by AI hype, suddenly deflate, what’s left holding up the S&P 491, which is already down 5% on the year?
Absolutely nothing.
S&P Bear Market Bottom Scenarios
| Earnings Decline | Historical Trough PE Of 14 (13 to 15 range) | Decline From Current Level | Peak Decline From Record Highs |
| 0% (Blue-chip consensus, mildest recession in history) | 3214 | 22.0% | -33.3% |
| 5% (Morgan Stanley) | 3054 | 25.9% | -36.6% |
| 10% | 2893 | 29.8% | -40.0% |
| 13% | 2796 | 32.1% | -42.0% |
| 15% (Moody’s 2-month debt default) | 2732 | 33.7% | -43.3% |
| 20% | 2571 | 37.6% | -46.6% |
| 25% | 2411 | 41.5% | -50.0% |
| 30% (3-month debt default) | 2250 | 45.4% | -53.3% |
This is why Morgan Stanley thinks stocks will mostly fall 26% before bottoming later this year (base-case September).
It’s why stocks have not likely bottomed even if we get a soft landing.
It’s why if we get a debt default, the 2022 bear market could become the 3rd 50% crash in the last two decades.
And guess what? Growth stocks? The kind that are crushing it this year and that so many people, including Greg, love? They are historically 25% more volatile than the S&P.
If the market falls 26%, as Morgan Stanley thinks is most likely, then growth stocks could fall around 33%.
And if we get a deft default? Growth stocks could potentially get cut in half.
How To Start A Large Portfolio Even In Crazy Times While Staying Safe And Sane
“Wait a second; you’re saying I might lose $3.3 million to $5 million if I buy my favorite growth stocks today? That’s crazy! I need to sit in cash!”
That’s Greg’s reaction to the idea of investing his remaining $10 million right now, and I’m sure that a lot of people would agree it seems crazy, especially for someone who just lost $1 million in “risk-free” U.S. bonds.
But let me show you how I convinced Greg that it’s not crazy; it’s “crazy like a fox.”
Wide Moat Research
This is the heart of the Dividend Kings ZEUS strategy.
- Zen Extraordinary Ultra SWAN (Sleep Well At Night).
The most effective hedging strategy of the last 53 years, combining long-duration U.S. treasuries with managed futures.
Why is a 33% allocation to the best hedging strategy in history so powerful? Because it leads to 50% to 75% smaller declines in bear markets? Sure, that’s part of it.
That’s what makes ZEUS the recession-optimized portfolio.
- 67% stocks 33% hedges is the optimal allocation since 1950 according to Nick Magiulli, Chief Data Scientist for Riholtz Wealth Management.
But here is why my life savings is invested in the ZEUS strategy.
I don’t mind volatility; in fact I want to embrace it like a lover.
What is Buffett’s “greedy when others are fearful” about if not buying bear market blue-chip bargains?
Charlie Bilello
How else can you earn 50% average gains in one year except by buying in bear markets?
This is the beauty of the best hedging strategy of the last 53 years.
On average, for every 1% the market falls, the hedging bucket goes up 1%.
So, the more stocks fall, the more your hedges make money.
Sure, that leads to much smaller peak declines, letting you ride over the market’s most extreme potholes in a Rolls Royce.
But it also means that you also have something to sell at a profit in a bear market.
Are you jealous of Warren Buffett’s $131 billion pile of cash at Berkshire Hathaway Inc. (BRK.A)? Wish you had his $2 billion in monthly free cash flow? Sure, who wouldn’t?
But when you have the best long-term hedging combo of the last 53 years working for you, then you can mint your own “dry powder” and always have a full “elephant gun” for blue-chip bargain hunting.
Do you know why 70% of the time, the best investment strategy is to be 100% fully invested?
Vanguard
Because stocks go up 76% of all years. But 30% of the time bear markets allow for rebalancing hedges into blue-chips at bear market valuations.
Historically owning some hedges and rebalancing in bear markets boosts returns by about 20%, even after taxes.
- 10% long-term returns become 12% long-term returns.
And let’s not forget the psychological benefit of a diversified portfolio that includes non-correlated asset classes.
Most people are terrified of bear markets. ZEUS investors love them.
The more stocks fall in the short-term, the more the hedges go up in value and the stronger the income and return boost over time.
Buffett never has to worry about not having cash to buy bargains in a bear market, and neither do ZEUS investors.
What if stocks don’t crash? What if they trade flat because for the first time in history we get a soft landing despite inflation starting at over 5%? What if the yield curve is wrong for the first time in 73 years?
Ben Carlson
What if stocks bottomed before the recession even began, for the first time in 77 years? Then a ZEUS investor wins, by being invested and letting the world’s greatest companies work for you.
What if stocks fall 26% and growth stocks fall 33%? Then ZEUS wins even bigger.
What if a debt default causes a 45% market crash and growth stocks get cut in half? Then ZEUS wins most of all.
With the ZEUS strategy, long-term investors can’t lose, not unless they panic sell, and with super low volatility, the risk of that is much smaller than with almost any other portfolio strategy.
How I Built A $10 Million Dividend Portfolio With 13 World-Beater Blue-Chips
Last weekend I spent 20 hours with Greg walking him through the most important DK “Preparing For Recession” videos and showing him how to use our tools.
- free of charge in exchange for permission to tell his story and show the portfolio
- as long as I changed his name and what state he lives in.
This is what he ended up deciding on, his ZEUS Hyper-Growth portfolio. The portfolio that’s ideally suited for his risk profile, goals, time horizon, and even his recent $1 million bomb-shell bond loss.
Greg’s Hyper-Growth Stock Bucket: 33% Of The Portfolio
Dividend Kings Zen Research Terminal
Here is the growth stock bucket in order of total return potential. I’ve linked to articles for further research.
- Amazon (AMZN)
- ASML Holding (ASML)
- Lowe’s (LOW)
- Brookfield Asset Management (BAM)
- Starbucks (SBUX)
- Netflix (NFLX)
- Mastercard (MA)
- Salesforce.com (CRM)
- Ameriprise Financial (AMP)
- Caterpillar (CAT)
Why these ten growth stocks?
Summary Fundamentals
- 92% Quality very low risk 13/13 Ultra SWANs
- 88% dividend safety: very safe, 1.6% severe recession cut risk
- yield 1.4% vs. 0.7% Nasdaq
- valuation: 21% discount to fair value vs. -2% Nasdaq
- growth consensus: 19.7% vs. 11.8% Nasdaq
- Long-term consensus total return potential: 21.1% vs. 12.5% Nasdaq
- 5-Year Consensus total return potential: 25.6% CAGR = 213% vs. 50% S&P
- S&P long-term risk management: 80th percentile -very low risk, excellent risk management
- Credit rating: A- stable 2.55 30-year bankruptcy risk.
Absolutely stunning fundamentals from these 10 hyper-growth Ultra SWANs.
Fortress balance sheets, excellent risk management, and dividends with twice the yield of the Nasdaq and much safer.
Ok, so the fundamentals look amazing, but what about that 21% long-term return potential? 9% more than the Nasdaq? That’s what analysts expect.
And it’s what they’ve delivered over the last 17 years.
Total Returns Since 2006
Portfolio Visualizer Premium
9% historically better annual returns than the Nasdaq, resulting in 4X better returns over the last 17 years.
Portfolio Visualizer Premium
Ok, that’s amazing historical returns, amazing consensus future returns, and fundamentals so beautiful they could make a grown man weep with joy.
But what about that pathetic yield of 1.4%? Sure, it’s twice that of the Nasdaq, but what is the point of a 1.4% yielding portfolio?
Because income growth tracks total returns over time.
22% Annual Income Growth Since 2007
Portfolio Visualizer Premium
From a 1.9% yield in 2007 to a 38% yield on cost in 2022 = 22% annual income growth.
- S&P 2.2% yield in 2007 to a 6.8% yield on cost in 2022 = 7.8% annual income growth
- Nasdaq: 0.4% yield in 2007 to 6.3% yield on cost in 2022 = 20.2% annual income growth.
The Nasdaq is the king of fast-growing dividends but was beaten by these ten hyper-growth Ultra SWANs. Some of which don’t actually pay dividends. Yet it’s still a superior dividend portfolio to the Nasdaq in nearly every fundamental way.
Now Add The Ultimate Growth ETF
The Howard Marks/John Templeton certainty limit says that you can only ever be 80% certain about the fundamentals of any given company.
After all, General Electric (GE) in 2000 was an AAA-rated dividend aristocrat that hadn’t missed earnings in a decade and was run by Fortune’s “CEO of the century.”
And we all know how that turned out.
I can say with 80% absolute certainty, “I’ll die on this hill” confidence that this is a wonderful Ultra SWAN hyper-dividend growth portfolio.
And what I’m wrong? What if all the fundamentals turn south in the coming years? What if each and every one of these is the next GE?
Then they would be sold long before they became permanent, catastrophic losses.
But do you know what Wall Street’s dirty secret is?
Wide Moat Research
Most stocks suck very badly. 44% of all U.S. stocks suffer 70+% crashes and never recover.
And that’s why the ZEUS strategy uses a 33% allocation to the world’s best ETFs.
Dividend Kings ETF Tracker
I personally like SPGP and COWZ as growth ETFs but Greg didn’t want them because they have high turnover and thus change what they owe across the economic cycle.
He wanted the king of fast-growth core world-beater ETFs, so that’s the Schwab U.S. Large-Cap Growth ETF (SCHG)
- Why SCHG is better than the Nasdaq.
Hedges: For Ultra SWANing And Rebalancing Into Bear Market Blue-Chip Bargains
Consider adding a 16.67% allocation to long-duration bonds like PIMCO 25+ Year Zero Coupon U.S. Treasury Index Exchange-Traded Fund ETF.
- 6 High-Yield ETFs For Up To 60% Gains In The Coming Recession.
And a 16.67% allocation to managed futures like KFA Mount Lucas Index Strategy ETF (KMLM).
- 4 High-Yield ETFs That Could Boost Your Retirement Income 33%.
ZEUS Hyper-Growth
| Stock | Yield | Growth | Total Return | Weighting | Weighted Yield | Weighted Growth | Weighted Return |
| SCHG | 0.5% | 13.5% | 14.0% | 33.33% | 0.2% | 4.5% | 4.7% |
| ZROZ | 4.0% | 0% | 4.0% | 16.67% | 0.7% | 0.0% | 0.7% |
| KMLM | 8.5% | 0.0% | 8.5% | 16.67% | 1.4% | 0.0% | 1.4% |
| AMZN | 0.0% | 27.6% | 27.6% | 3.33% | 0.0% | 0.9% | 0.9% |
| LOW | 2.0% | 19.7% | 21.7% | 3.33% | 0.1% | 0.7% | 0.7% |
| MA | 0.6% | 19.1% | 19.7% | 3.33% | 0.0% | 0.6% | 0.7% |
| ASML | 1.0% | 24.2% | 25.2% | 3.33% | 0.0% | 0.8% | 0.8% |
| BAM | 4.1% | 17.5% | 21.6% | 3.33% | 0.1% | 0.6% | 0.7% |
| SBUX | 2.1% | 19.1% | 21.2% | 3.33% | 0.1% | 0.6% | 0.7% |
| NFLX | 0% | 18.40% | 18.40% | 3.33% | 0.0% | 0.6% | 0.6% |
| CRM | 0% | 18.60% | 18.60% | 3.33% | 0.0% | 0.6% | 0.6% |
| AMP | 1.80% | 15.90% | 17.70% | 3.33% | 0.1% | 0.5% | 0.6% |
| CAT | 2.3% | 15.30% | 17.56% | 3.33% | 0.1% | 0.5% | 0.6% |
| Total | 100.00% | 2.7% | 11.0% | 13.7% |
Now you might not think that 13.7% long-term return potential is that impressive. But consider this.
Nasdaq’s Historical Returns
Lazy Portfolio ETF
The Nasdaq is the best-performing index in American history, with 13.5% annual returns for 37 years.
- $1 invested in 1985 is now worth $116
- $40 adjusted for inflation.
ZEUS Hyper-Growth Vs. Nasdaq
| Metric | Nasdaq | ZEUS Hyper-Growth | X Better Than S&P 500 |
| Yield | 0.7% | 2.7% | 3.86 |
| Growth Consensus | 11.7% | 11.0% | 0.94 |
| LT Consensus Total Return Potential | 12.4% | 13.7% | 1.10 |
| Risk-Adjusted Expected Return | 8.7% | 9.6% | 1.10 |
| Safe Withdrawal Rate (Risk And Inflation-Adjusted Expected Returns) | 6.4% | 7.3% | 1.14 |
| Conservative Time To Double (Years) | 11.2 | 9.8 | 1.14 |
(Sources: DK Research Terminal, FactSet.)
Better return potential than the Nasdaq, with 4X the yield and a safe withdrawal rate of 7%, 3X that of a 60/40.
What about the historical returns?
Historical Returns Since December 2007 (Start Of The Great Recession)
Portfolio Visualizer Premium
A 67% stock 33% hedged portfolio beating the Nasdaq? Impossible! Yet it happened, and analysts think that over the long term it will keep happening.
Portfolio Visualizer Premium
Even the average annual rolling returns kept up with the Nasdaq during a period when the Nasdaq was all but unbeatable.
And don’t forget about one of the key reasons to own a ZEUS portfolio, volatility so low it’s like rolling over the most extreme market potholes in a Rolls Royce.
Historical Bear Markets
| Bear Market | ZEUS Hyper-Growth | 60/40 | S&P | Nasdaq |
| 2022 Stagflation | -20% | -21% | -28% | -35% |
| Pandemic Crash | -6% | -13% | -34% | -13% |
| 2018 | -13% | -9% | -21% | -17% |
| 2011 Debt Ceiling Crisis | -2% | -16% | -22% | -11% |
| Great Recession | -25% | -44% | -58% | -59% |
| 2008 | -12% | -33% | -37% | -42% |
| Average | -13% | -23% | -33% | -30% |
| Median Decline | -13% | -19% | -31% | -26% |
40% smaller peak declines than a 60/40, 60% smaller peak declines than the S&P, and 55% smaller declines than the Nasdaq during bear markets.
Now that’s SWANiness.
In 2011’s debt ceiling crisis, ZEUS Hyper-Growth fell 80% less than the Nasdaq and 90% less than the S&P. In fact, it barely fell at all, just 2%, and that was the peak decline.
75-Year Monte Carlo Simulation: A Statistical Look At The Likely Future
10,000 simulations of the next 75 years based on the last 15 years.
Portfolio Visualizer Premium
Over the next 75 years, this portfolio is statistically most likely to deliver 11.5% inflation-adjusted returns turning Greg’s $10 million into $36 billion in today’s money.
It’s 90% likely never to suffer worse than a 43% peak decline.
Portfolio Visualizer Premium
It’s 99.89% likely to beat a 60/40 over the next 50 years.
It’s 97.37% likely to beat the S&P 500 over the next 50 years.
It’s 80% likely to beat the Nasdaq over the next 50 years.
Greg defines success as beating the Nasdaq while avoiding Nasdaq like 50+% crashes as success.
Portfolio Visualizer Premium
Not only is this portfolio not likely to fall 50%, but its probability of falling even 40% is just 0.28% over the next 75 years.
- A 40+% crash is expected once every 26,775 years.
Heck, a 20+% bear market is only a 5% probability.
- A bear market occurs once every 1,500 years.
Impressed yet? Greg was amazed at the power of ZEUS to create a dividend hyper-growth portfolio that’s superior to the Nasdaq in every way.
So let’s take a closer look at the fundamentals of the portfolio.
ZEUS Hyper-Growth Fundamentals Review
Morningstar
This was designed to be a large-cap growth portfolio though its 36% invested in other things as well.
Morningstar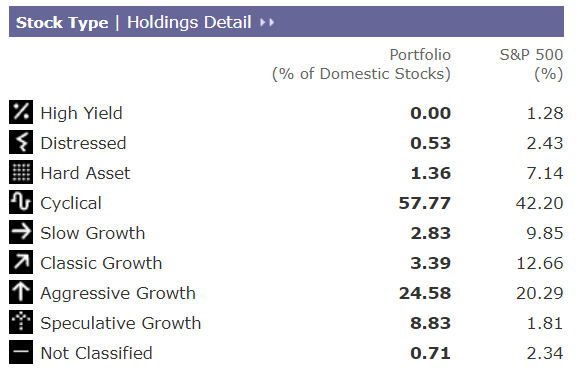

It’s an aggressive growth portfolio.
Morningstar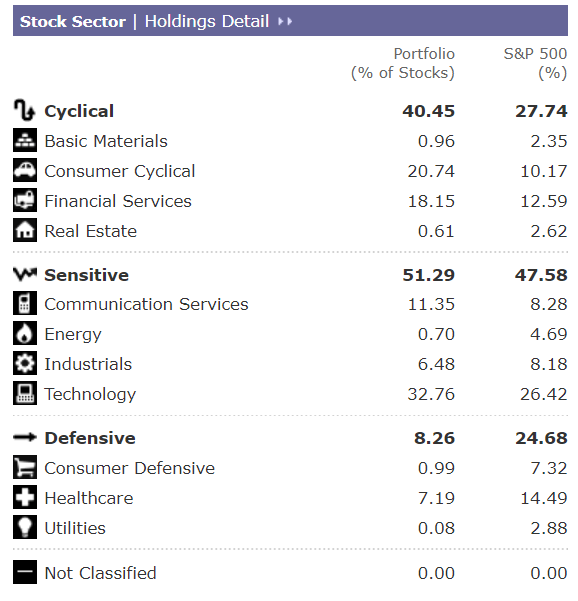

Naturally, it’s tech-focused but has exposure to every part of the economy.
Morningstar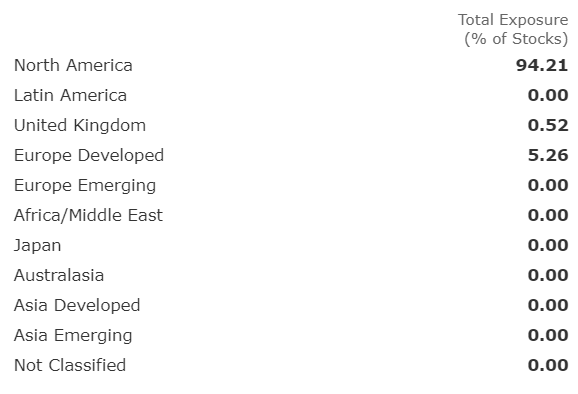

It’s all North American and European companies, as that’s where almost all world beaters come from.
Morningstar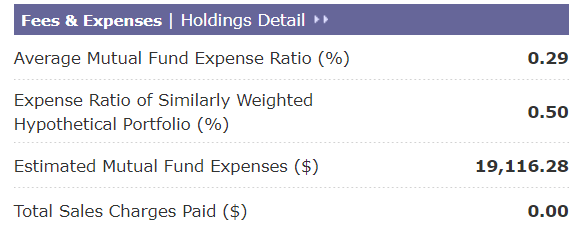

The average hedge fund charges 5% per year in fees via the 2% and 20% structure.
ZEUS Hyper-Growth costs 0.29%, 17X less.
In fact, while the typical hedge fund would cost Greg $500,000 per year in fees, with ZEUS hyper-growth, it’s just $19,116.28.
- $481,000 more he can donate to charity each year.
Do you know why that matters? Because Greg isn’t looking to get a lot richer over time. He’s out to save lives and change the world.
How Greg’s ZEUS Hyper-Growth Portfolio Could Save 10 Million Lives In The Next 75 Years
Now that he’s sold his business and achieved financial success greater than most people can ever dream of, Greg’s big goal is to save lives.
Helen Keller International is his favorite charity. It’s mine as well; he’s the one who told me about it.
- 2:1 match is now available through June 5th (up to $100,000); I’m donating $4,100 to save 2.34 children.
Thelifeyoucansave Thelifeyoucansave
If you want extensive and rigorous statistical and scientific proof (including dozens of studies) that HKI is one of the most effective charities on earth, you can read GiveWell’s extremely detailed report here.
GiveWell
Rest assured; this is scientific spreadsheet altruism at its finest.
GiveWell
GiveWell ranks Helen Keller International as one of the four most effective charities in the world as measured by the cost of life saved.
$3,500 to save one child’s life by administering 2,846 vitamin A supplemental doses for children between the ages of 6 months and six years.
For approximately $700 million per year, the 200,000 annual vitamin-A deficiency-related deaths could be eliminated from the earth.
200,000 children per year die, the equivalent of the population of Santa Barbara, California, or Oxford, England. This is 100% unnecessary, and I will help stop it, and so will Greg.
How Much Of A Difference Greg’s Portfolio Can Make
Do you know why I spent 30 hours working with Greg on this article? Because he’s not just a good person, he’s one of the greatest humans I’ve ever met.
He’s planning on turning his ZEUS portfolio into a charitable trust, which will be the most effective way of saving young children from vitamin A deficiency.
Charitable trusts avoid 98% of taxes paid in taxable accounts as long as they pay 5% of their investable assets yearly.
- He’s planning on paying himself 0.5% of his assets to cover his living expenses to administer the trust
- and another 0.5% to cover all legal/compliance costs, including board members.
In other words, Greg wants to take his life’s fortune and start saving lives immediately while still living a comfortable lifestyle.
- his wife will get a $60,000 annual pension when she retires in 20 years
- she’s currently making $100,000 per year.
Ok, so how much can Greg expect to donate with a perpetual charitable ZEUS Hyper-Growth trust? Here are the statistical estimates in inflation-adjusted terms.
- 10th percentile (realistic worst case): $6.4 billion over 75 years ($85 million per year average) = 1.8 million children saved
- 25th percentile (conservative case): $14.8 billion over 75 years ($197 million per year on average = 4.2 million children saved
- 50th percentile (base-case): $35.1 billion over 75 years ($466 million per year on average) = 9.9 million children saved
- 75th percentile (bullish case): $82.1 billion over 75 years ($1.1 billion per year on average) = 23 million children saved
- 90th percentile (best case): $173 billion over 75 years ($2.3 billion per year on average) = 49 million children saved.
Remember that for $700 million per year ($52.5 inflation-adjusted dollars over 75 years), all 200,000 needless child deaths from vitamin A deficiency can be stopped.
With this ZEUS Hyper-Growth portfolio, 67% of those deaths can be prevented…by Greg alone.
Add in my trust’s donations, and Greg and I together will solve this problem within 75 years.
And in reality, other people donating will solve it much quicker.
And once this problem is solved, Greg and I will direct excess donations wherever they can save the most lives and lift the most people out of poverty.
- 5 Dividend ETFs That Could Change Your Life And The World.
An introduction to Ben Franklin’s “Invest to give” philosophy of charity.
Harnessing the world-changing power of compounding and capitalism to make the world a better place.
Bottom Line: The World’s Best Dividend Growth Stocks Can Change Your Life And The World
I’ve had the joy and privilege of teaching thousands of people over the years to invest better and put themselves on track to achieve their financial dreams.
I’ve relished the chance to help friends and family rescue their retirements and financial goals.
I’ve worked with some amazing people, some who did everything right and some who, like Justin and Greg, made simple mistakes that cost them a fortune.
But never have I been so inspired by a man as this, whose life epitomizes the American dream and whose financial aspirations are the ultimate example of humanity’s better angels.
This man is my brother from another mother, and together we build a portfolio that will improve the world, save lives, and change the course of human history.
All thanks to these 10 hyper-growth world-beaters:
- Amazon
- ASML Holding
- Lowe’s
- Brookfield Asset Management
- Starbucks
- Netflix
- Mastercard
- Salesforce.com
- Ameriprise Financial
- Caterpillar.
Along with 3 ETFs, Greg’s dream of ending vitamin A-deficiency child deaths is well on track.
- SCHG for growth
- ZROZ for long bonds
- KMLM for managed futures.
Maybe you don’t have $10 million to invest; maybe it’s just $10,000 or even $1,000. The ZEUS investing strategy works at any scale and can help anyone live their best investing life.
But I hope you take Greg’s inspirational story and the lessons I’ve taught him and so many other readers over the years to find hope in what might seem to be a hopeless world right now.
If you can trust anything, trust that thanks to great people in the world like Greg and his wonderful family, we will get through this together.
The debt ceiling crisis of 2023 is scary. The recession of 2023 will likely be scarier. And the coming bear market is going to feel like the end of the world to many.
But as someone who has been through far worse, including three recessions, six bear markets, and two economic catastrophes, I have faith; the end is not night.
A brighter future is coming faster than you think, and Ultra SWAN world-beater portfolio like this can help you ride out the storm and embrace the bull market joys on the other side.